Dauguma kompiuterių pardavėjų aprašo kompiuterį. Jo atmintį, vaizdo plokštę ir pnš. Tačiau kai kurie kompiuterių turėtojai nežino kokią vaizdo plokšte jie naudoja. Pasitelkę šią programą galėsite sužinoti visus plokštės parametrus.
English:
 A Graphics Card and OpenGL Information Utility
GPU Caps Viewer is a tool that lets you monitor the activity of your graphics card.
For example, if you are a hardcore gamer or a web developer who uses demanding applications when it comes to graphics, this software can come to your aid.
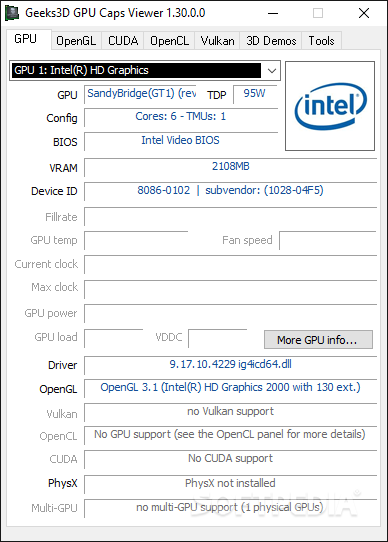
The user interface of GPU Caps Viewer is standard. So, you can view various information about your GPU, including shader cores, BIOS, device ID, subdevice ID, GPU temperature, current and maximum clock, GPU load, driver, OpenGL, OpenCL, CUDA, PhysX and multi-GPU.
But you can also start an OpenGL or OpenCL demo, view the OpenGL version and its extensions list, the number of CUDA devices, core data (name, compute capability, shader clock, multi processors, warp and grid size etc) and memory data (e.g. total memory, shared memory, total constant).
Furthermore, you can check out OpenCL information, such as version, number of CL devices, type, compute units, clock, driver, global and local memory, 2D and 3D image size, work item sizes, constant buffer, maximum sampler, extensions, work group size, and more.
In addition, you can view system information (CPU, CPU speed, CPU cores, operating system, memory, current display mode, and more), as well as web links, validation data and active 3D applications. Information can be exported to TXT or XML.
The program uses a high amount of system resources and didn’t freeze or crash during our tests. However, it doesn’t contain a help file. But even if it did, first-time users would have a hard time comprehending its technical terms. Thus, we recommend GPU Caps Viewer mainly to power users.
Here are some key features of „GPU Caps Viewer“:
· quick view of the graphics configuration (graphics card / GPU type, amount of video memory, drivers version)
· display of the main OpenGL capabilities (OpenGL version, texture size, number of texture units, etc.)
· display of the OpenGL extensions supported by your graphics card or display of all existing OpenGL extensions no matter what graphics card you have. For each extension, you can open its description webpage available at the OpenGL Extension Registry or at NVIDIA’s OpenGL Extensions spec. Very handy for graphics developers!
· display of the system configuration: CPU type and speed, amount of systeme memory, operating system
· GPU Burner: allows to make the GPU temperature climb in order to test the graphics card stability. You can actually open as many 3D views as you want in order to make your graphics card working to the maximum. For NVIDIA cards, the GPU temperature is also displayed.
· list of links related to your graphics card: graphics drivers and graphics cards reviews. These links are regularly updated.
· full report in text and XML format. This kind of report is useful for developers who needs an outline of the customer graphics system (for support purposes for example).
What’s New in This Release:
· Bugfix: removed some XML errors: duplicated attributes, unexpected elements (graphics_controller) and moved PStates in separate XML elements inside gpu element. OpenCL extensions have been updated and included in the device element.
· Update: ZoomGPU 1.8.8 (GPU monitoring lib).


